Pro-labor slogans are painted on union members’ cars during a rally at the Motion Picture Editors Guild IATSE Local 700 on Sunday, Sept. 26, 2021 in Los Angeles. (Myung J. Chun/Los Angeles Times/TNS)
Ratcheting up pressure on the major studios, the union representing Hollywood crews announced Wednesday that its members will go on strike on Monday if they can’t reach agreement on a new contract.
A walkout would bring film and television productions across the country to a standstill and would be the biggest Hollywood labor dispute in more than a decade. The International Alliance of Theatrical Stage Employees represents about 60,000 film set workers nationwide.
Wednesday’s announcement from IATSE represents a line in the sand for how long the organization will let talks continue without resolution. Negotiations will continue this week, the union said.
“Without an end date, we could keep talking forever,” IATSE President Matthew Loeb said in a statement. “Our members deserve to have their basic needs addressed now.”
IATSE’s film and television contract with the Alliance of Motion Picture and Television Producers (AMPTP) first expired on July 31 and was extended until Sept.10.
“There are five whole days left to reach a deal, and the studios will continue to negotiate in good faith in an effort to reach an agreement for a new contract that will keep the industry working,” AMPTP spokesman Jarryd Gonzales said in a statement.
The two sides returned to the negotiating table last week and have made progress, but tensions have been growing. Loeb recently told his members the decision to strike would come in a matter of days, not weeks.
“Despite our best efforts at the table, the pace of negotiations does not reflect the urgency of the situation,” Catherine Repola, national executive director of Motion Picture Editors Guild, Local 700, said in a note to members Tuesday.
The union has been seeking improvements in rest periods and wages and compensation from streaming productions that it believes are unfairly discounted.
Crews have shared stories of long hours and dangerous working conditions, which have dogged the industry for decades.
A shutdown would come at the worst time for producers, just as they are trying to catch up from delays due to the pandemic and as competition between streaming platforms is heating up.
With no signs of progress, last month IATSE called its first strike authorization vote in 128 years. The result was an almost unanimous vote in favor of strike action. The turnout was unusually high, with 90% of eligible union members participating in the vote and 99% of those voting in favor, IATSE said.
The AMPTP, which represents a wide range of producers, including Walt Disney, Netflix and Apple, has said that it has made concessions to the union, offering to cover shortfalls in its pension and health plans and increase wages.
100 least popular jobs in America
100 least popular jobs in America

Spend enough time watching the Discovery Channel and you’ll eventually run into Mike Rowe doing one stomach-churning task after the other on the hit TV show “Dirty Jobs.” The Baltimore-born host is also known for his CNN series “Somebody’s Gotta Do It,” whose title underscores the fact that even the most menial and unsavory jobs serve important functions that need to be carried out by a small workforce.
The reasons a certain field might not contain very many many professionals vary widely. Certain positions are only held by a small number due to their unpleasant nature. The jobs on this list are individually held by about 7,500 people or less, for reasons including jobs limited to particular geographic locations, requiring extensive education, or revolving around a niche and specialized craft.
Using data from the Bureau of Labor Statistics from May 2020 (released March 30, 2021), Stacker ranked the 100 least popular jobs in America by total employment. Only detailed job categories were included in the dataset. Every position’s number of total workers in the United States is listed alongside its average annual wage and average hourly wage, where each of those figures is available.
Read on to see if you hold one of the least popular jobs in the nation.
You may also like: Former jobs of the governor of every state
#100. Parking Enforcement Workers

– Number employed: 7,560
– Annual mean wage: $44,870 (20.3% below mean for all occupations)
– Median hourly wage: $20.23
#99. Epidemiologists

– Number employed: 7,500
– Annual mean wage: $83,620 (48.5% above mean for all occupations)
– Median hourly wage: $35.84
#98. Gambling and Sports Book Writers and Runners

– Number employed: 7,500
– Annual mean wage: $27,130 (51.8% below mean for all occupations)
– Median hourly wage: $12.13
#97. Ship Engineers

– Number employed: 7,480
– Annual mean wage: $81,110 (44.0% above mean for all occupations)
– Median hourly wage: $36.53
#95. Shoe and Leather Workers and Repairers

– Number employed: 7,380
– Annual mean wage: $31,480 (44.1% below mean for all occupations)
– Median hourly wage: $14.69
#94. Dancers

– Number employed: 7,370
– Annual mean wage: -$04 (100.0% below mean for all occupations)
– Median hourly wage: $18.58
#93. Exercise Physiologists

– Number employed: 7,330
– Annual mean wage: $54,020 (4.1% below mean for all occupations)
– Median hourly wage: $24.17
#92. Woodworkers, All Other

– Number employed: 7,300
– Annual mean wage: $35,710 (36.6% below mean for all occupations)
– Median hourly wage: $16.17
#91. Textile Bleaching and Dyeing Machine Operators and Tenders

– Number employed: 7,260
– Annual mean wage: $31,600 (43.9% below mean for all occupations)
– Median hourly wage: $14.55
You may also like: 100 Highest Paying Jobs In America
#89. Fish and Game Wardens

– Number employed: 7,230
– Annual mean wage: $57,810 (2.7% above mean for all occupations)
– Median hourly wage: $27.90
#88. Artists and Related Workers, All Other

– Number employed: 7,220
– Annual mean wage: $69,650 (23.7% above mean for all occupations)
– Median hourly wage: $31.63
#87. Pourers and Casters, Metal
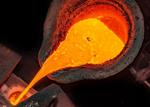
– Number employed: 7,200
– Annual mean wage: $42,440 (24.6% below mean for all occupations)
– Median hourly wage: $19.31
#85. Nurse Midwives

– Number employed: 7,120
– Annual mean wage: $115,540 (105.2% above mean for all occupations)
– Median hourly wage: $53.43
#84. Desktop Publishers

– Number employed: 7,090
– Annual mean wage: $50,600 (10.1% below mean for all occupations)
– Median hourly wage: $22.86
#83. Musical Instrument Repairers and Tuners

– Number employed: 7,070
– Annual mean wage: $39,770 (29.4% below mean for all occupations)
– Median hourly wage: $17.70
#82. Materials Scientists

– Number employed: 6,930
– Annual mean wage: $104,450 (85.5% above mean for all occupations)
– Median hourly wage: $47.82
#81. Architecture Teachers, Postsecondary

– Number employed: 6,910
– Annual mean wage: $100,820 (79.0% above mean for all occupations)
– Median hourly wage: -$4.00
You may also like: Highest-Paid Jobs in Health Care
#80. Proofreaders and Copy Markers

– Number employed: 6,610
– Annual mean wage: $44,670 (20.7% below mean for all occupations)
– Median hourly wage: $19.78
#79. Archivists

– Number employed: 6,550
– Annual mean wage: $61,210 (8.7% above mean for all occupations)
– Median hourly wage: $27.29
#78. Life Scientists, All Other

– Number employed: 6,540
– Annual mean wage: $92,170 (63.7% above mean for all occupations)
– Median hourly wage: $39.42
#77. Forest and Conservation Workers

– Number employed: 6,490
– Annual mean wage: $33,520 (40.5% below mean for all occupations)
– Median hourly wage: $14.73
#75. Mining and Geological Engineers, Including Mining Safety Engineers

– Number employed: 6,270
– Annual mean wage: $100,140 (77.8% above mean for all occupations)
– Median hourly wage: $45.10
#74. Hydrologists
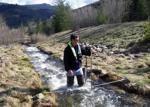
– Number employed: 6,170
– Annual mean wage: $90,150 (60.1% above mean for all occupations)
– Median hourly wage: $40.41
#73. Nuclear Technicians

– Number employed: 6,160
– Annual mean wage: $83,810 (48.8% above mean for all occupations)
– Median hourly wage: $40.48
#72. Correspondence Clerks

– Number employed: 6,150
– Annual mean wage: $40,070 (28.8% below mean for all occupations)
– Median hourly wage: $18.46
#71. Tool Grinders, Filers, and Sharpeners

– Number employed: 6,080
– Annual mean wage: $43,670 (22.4% below mean for all occupations)
– Median hourly wage: $19.74
You may also like: Jobs Projected to Grow the Most in the Next Decade
#70. Political Scientists

– Number employed: 6,010
– Annual mean wage: $124,100 (120.4% above mean for all occupations)
– Median hourly wage: $60.27
#69. Environmental Science Teachers, Postsecondary

– Number employed: 5,860
– Annual mean wage: $94,520 (67.9% above mean for all occupations)
– Median hourly wage: unavailable
#68. Wind Turbine Service Technicians
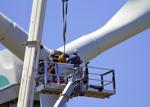
– Number employed: 5,860
– Annual mean wage: $59,340 (5.4% above mean for all occupations)
– Median hourly wage: $27.03
#67. Arbitrators, Mediators, and Conciliators

– Number employed: 5,810
– Annual mean wage: $76,440 (35.7% above mean for all occupations)
– Median hourly wage: $31.79
#66. Costume Attendants

– Number employed: 5,750
– Annual mean wage: $51,780 (8.0% below mean for all occupations)
– Median hourly wage: $20.63
You may also like: College majors that make the most money
#65. Farmers, Ranchers, and Other Agricultural Managers
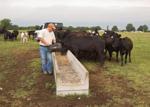
– Number employed: 5,670
– Annual mean wage: $76,810 (36.4% above mean for all occupations)
– Median hourly wage: $32.73
#64. Occupational Therapy Aides

– Number employed: 5,630
– Annual mean wage: $34,160 (39.3% below mean for all occupations)
– Median hourly wage: $14.51
#63. Dentists, All Other Specialists

– Number employed: 5,610
– Annual mean wage: $194,930 (246.2% above mean for all occupations)
– Median hourly wage: $88.12
#62. Anthropology and Archeology Teachers, Postsecondary

– Number employed: 5,590
– Annual mean wage: $98,740 (75.4% above mean for all occupations)
– Median hourly wage: unavailable
#60. Floor Sanders and Finishers

– Number employed: 5,100
– Annual mean wage: $41,400 (26.5% below mean for all occupations)
– Median hourly wage: $18.68
#59. Orthodontists

– Number employed: 5,040
– Annual mean wage: $237,990 (322.6% above mean for all occupations)
– Median hourly wage: unavailable
#58. Fallers

– Number employed: 4,820
– Annual mean wage: $49,520 (12.1% below mean for all occupations)
– Median hourly wage: $20.76
#57. Fabric and Apparel Patternmakers

– Number employed: 4,670
– Annual mean wage: $57,880 (2.8% above mean for all occupations)
– Median hourly wage: $23.88
#55. Telephone Operators

– Number employed: 4,630
– Annual mean wage: $39,340 (30.1% below mean for all occupations)
– Median hourly wage: $18.13
#54. Rail Yard Engineers, Dinkey Operators, and Hostlers

– Number employed: 4,580
– Annual mean wage: $55,200 (2.0% below mean for all occupations)
– Median hourly wage: $24.86
#53. Hoist and Winch Operators

– Number employed: 4,460
– Annual mean wage: $62,730 (11.4% above mean for all occupations)
– Median hourly wage: $30.10
#52. Library Science Teachers, Postsecondary

– Number employed: 4,230
– Annual mean wage: $77,560 (37.7% above mean for all occupations)
– Median hourly wage: unavailable
#51. Oral and Maxillofacial Surgeons

– Number employed: 4,120
– Annual mean wage: $234,990 (317.3% above mean for all occupations)
– Median hourly wage: unavailable
You may also like: Best jobs that require a bachelor’s degree
#50. Craft Artists
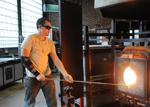
– Number employed: 4,090
– Annual mean wage: $38,260 (32.1% below mean for all occupations)
– Median hourly wage: $16.92
#49. Shoe Machine Operators and Tenders

– Number employed: 4,080
– Annual mean wage: $31,430 (44.2% below mean for all occupations)
– Median hourly wage: $14.72
#48. Entertainment Attendants and Related Workers, All Other

– Number employed: 3,900
– Annual mean wage: $32,580 (42.1% below mean for all occupations)
– Median hourly wage: $13.09
#47. Embalmers

– Number employed: 3,860
– Annual mean wage: $50,220 (10.8% below mean for all occupations)
– Median hourly wage: $22.90
#46. Logging Workers, All Other

– Number employed: 3,850
– Annual mean wage: $41,830 (25.7% below mean for all occupations)
– Median hourly wage: $19.91
You may also like: Dangerous Jobs From Throughout Human History
#45. Pile Driver Operators

– Number employed: 3,820
– Annual mean wage: $71,880 (27.7% above mean for all occupations)
– Median hourly wage: $30.47
#44. Transit and Railroad Police

– Number employed: 3,800
– Annual mean wage: $71,000 (26.1% above mean for all occupations)
– Median hourly wage: $34.89
#43. Gas Compressor and Gas Pumping Station Operators

– Number employed: 3,800
– Annual mean wage: $63,770 (13.2% above mean for all occupations)
– Median hourly wage: $32.62
#42. Geography Teachers, Postsecondary

– Number employed: 3,720
– Annual mean wage: $87,160 (54.8% above mean for all occupations)
– Median hourly wage: unavailable
#41. Choreographers

– Number employed: 3,580
– Annual mean wage: $52,000 (7.7% below mean for all occupations)
– Median hourly wage: $21.00
You may also like: History of workers’ strikes in America
#40. Loading and Moving Machine Operators, Underground Mining

– Number employed: 3,520
– Annual mean wage: $56,100 (0.4% below mean for all occupations)
– Median hourly wage: $27.23
#39. Commercial Divers

– Number employed: 3,460
– Annual mean wage: $71,850 (27.6% above mean for all occupations)
– Median hourly wage: $26.35
#38. Sewers, Hand

– Number employed: 3,410
– Annual mean wage: $30,790 (45.3% below mean for all occupations)
– Median hourly wage: $14.42
#37. Model Makers, Metal and Plastic

– Number employed: 3,400
– Annual mean wage: $58,180 (3.3% above mean for all occupations)
– Median hourly wage: $26.33
#36. Log Graders and Scalers

– Number employed: 3,390
– Annual mean wage: $38,940 (30.8% below mean for all occupations)
– Median hourly wage: $17.74
You may also like: 100 Lowest-Paying Jobs in America
#35. Camera and Photographic Equipment Repairers

– Number employed: 3,320
– Annual mean wage: $42,740 (24.1% below mean for all occupations)
– Median hourly wage: $19.39
#34. Gambling Managers

– Number employed: 3,240
– Annual mean wage: $85,440 (51.7% above mean for all occupations)
– Median hourly wage: $36.28
#33. Bridge and Lock Tenders

– Number employed: 3,080
– Annual mean wage: $49,610 (11.9% below mean for all occupations)
– Median hourly wage: $25.16
#32. Communications Equipment Operators, All Other

– Number employed: 3,070
– Annual mean wage: $49,260 (12.5% below mean for all occupations)
– Median hourly wage: $22.44
#31. Terrazzo Workers and Finishers
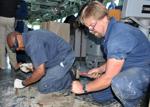
– Number employed: 2,970
– Annual mean wage: $56,440 (0.2% above mean for all occupations)
– Median hourly wage: $24.73
You may also like: 50 college majors that earn the least money
#30. Forest Fire Inspectors and Prevention Specialists

– Number employed: 2,900
– Annual mean wage: $52,130 (7.4% below mean for all occupations)
– Median hourly wage: $20.26
#29. Manufactured Building and Mobile Home Installers

– Number employed: 2,900
– Annual mean wage: $36,360 (35.4% below mean for all occupations)
– Median hourly wage: $16.89
#28. Paperhangers

– Number employed: 2,820
– Annual mean wage: $49,820 (11.5% below mean for all occupations)
– Median hourly wage: $20.94
#27. Makeup Artists, Theatrical and Performance

– Number employed: 2,780
– Annual mean wage: $99,990 (77.6% above mean for all occupations)
– Median hourly wage: $51.40
#25. Animal Scientists

– Number employed: 2,680
– Annual mean wage: $74,540 (32.4% above mean for all occupations)
– Median hourly wage: $30.52
#24. Sociologists

– Number employed: 2,470
– Annual mean wage: $93,420 (65.9% above mean for all occupations)
– Median hourly wage: $41.40
#23. Mathematicians

– Number employed: 2,460
– Annual mean wage: $112,530 (99.8% above mean for all occupations)
– Median hourly wage: $53.30
#22. Watch and Clock Repairers

– Number employed: 2,430
– Annual mean wage: $48,560 (13.8% below mean for all occupations)
– Median hourly wage: $21.77
#21. Patternmakers, Metal and Plastic

– Number employed: 2,400
– Annual mean wage: $49,570 (12.0% below mean for all occupations)
– Median hourly wage: $23.16
You may also like: Most common jobs in America
#20. Motorboat Operators

– Number employed: 2,380
– Annual mean wage: $53,500 (5.0% below mean for all occupations)
– Median hourly wage: $26.88
#19. Models

– Number employed: 2,350
– Annual mean wage: $54,050 (4.0% below mean for all occupations)
– Median hourly wage: $15.34
#18. Genetic Counselors

– Number employed: 2,280
– Annual mean wage: $89,710 (59.3% above mean for all occupations)
– Median hourly wage: $41.20
#17. Family and Consumer Sciences Teachers, Postsecondary

– Number employed: 2,270
– Annual mean wage: $81,580 (44.9% above mean for all occupations)
– Median hourly wage: unavailable
#16. Motion Picture Projectionists

– Number employed: 2,270
– Annual mean wage: $34,380 (38.9% below mean for all occupations)
– Median hourly wage: $13.22
You may also like: Worst jobs in America
#15. Roof Bolters, Mining

– Number employed: 2,080
– Annual mean wage: $61,900 (9.9% above mean for all occupations)
– Median hourly wage: $29.42
#14. Astronomers
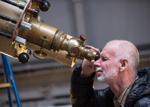
– Number employed: 1,910
– Annual mean wage: $126,250 (124.2% above mean for all occupations)
– Median hourly wage: $57.56
#13. Dredge Operators

– Number employed: 1,750
– Annual mean wage: $53,790 (4.5% below mean for all occupations)
– Median hourly wage: $23.66
#12. Rail Transportation Workers, All Other
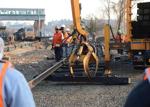
– Number employed: 1,540
– Annual mean wage: $54,670 (2.9% below mean for all occupations)
– Median hourly wage: $23.06
#11. Forestry and Conservation Science Teachers, Postsecondary

– Number employed: 1,460
– Annual mean wage: $92,420 (64.1% above mean for all occupations)
– Median hourly wage: unavailable
You may also like: Most common jobs in America 100 years ago
#10. Geographers

– Number employed: 1,450
– Annual mean wage: $85,620 (52.1% above mean for all occupations)
– Median hourly wage: $41.07
#9. Agricultural Engineers

– Number employed: 1,440
– Annual mean wage: $101,620 (80.5% above mean for all occupations)
– Median hourly wage: $40.58
#8. Timing Device Assemblers and Adjusters

– Number employed: 1,000
– Annual mean wage: $39,430 (30.0% below mean for all occupations)
– Median hourly wage: $17.39
#7. Animal Breeders

– Number employed: 920
– Annual mean wage: $43,930 (22.0% below mean for all occupations)
– Median hourly wage: $19.60
#6. Model Makers, Wood

– Number employed: 800
– Annual mean wage: $62,600 (11.2% above mean for all occupations)
– Median hourly wage: $30.79
You may also like: Jobs Most in Danger of Being Automated
#5. Industrial-Organizational Psychologists

– Number employed: 780
– Annual mean wage: $112,690 (100.1% above mean for all occupations)
– Median hourly wage: $46.28
#4. Refractory Materials Repairers, Except Brickmasons
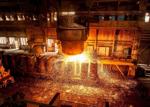
– Number employed: 760
– Annual mean wage: $55,080 (2.2% below mean for all occupations)
– Median hourly wage: $26.26
#3. Prosthodontists

– Number employed: 530
– Annual mean wage: $214,870 (281.6% above mean for all occupations)
– Median hourly wage: unavailable
#2. Cooks, Private Household

– Number employed: 320
– Annual mean wage: $46,810 (16.9% below mean for all occupations)
– Median hourly wage: $15.69
#1. Patternmakers, Wood

– Number employed: 190
– Annual mean wage: $60,750 (7.9% above mean for all occupations)
– Median hourly wage: $31.31
You may also like: 50 most physical jobs in America
#90. Signal and Track Switch Repairers

– Number employed: 7,250
– Annual mean wage: $75,970 (34.9% above mean for all occupations)
– Median hourly wage: $36.64
Hollywood crews say they will strike next week if there is no agreement | Entertainment Source link Hollywood crews say they will strike next week if there is no agreement | Entertainment
The post Hollywood crews say they will strike next week if there is no agreement | Entertainment appeared first on Illinois News Today.


No comments:
Post a Comment